Urban Consumer Price Index From July Unchanged, BLS Report
After increasing by 1.3% in June, the urban Consumer Price Index (CPI) remained unchanged in July on seasonal adjustment, according to a press release by the U.S. Bureau of Labor Statistics (BLS). An indicator of spending patterns for city consumers and workers, the all-item index soared 8.5% over the last 12 months before seasonal adjustment.
Although the food and shelter indexes increased in July, the gasoline index dropped 7.7%, which is why the overall CPI didn’t change during that month.
Food Index
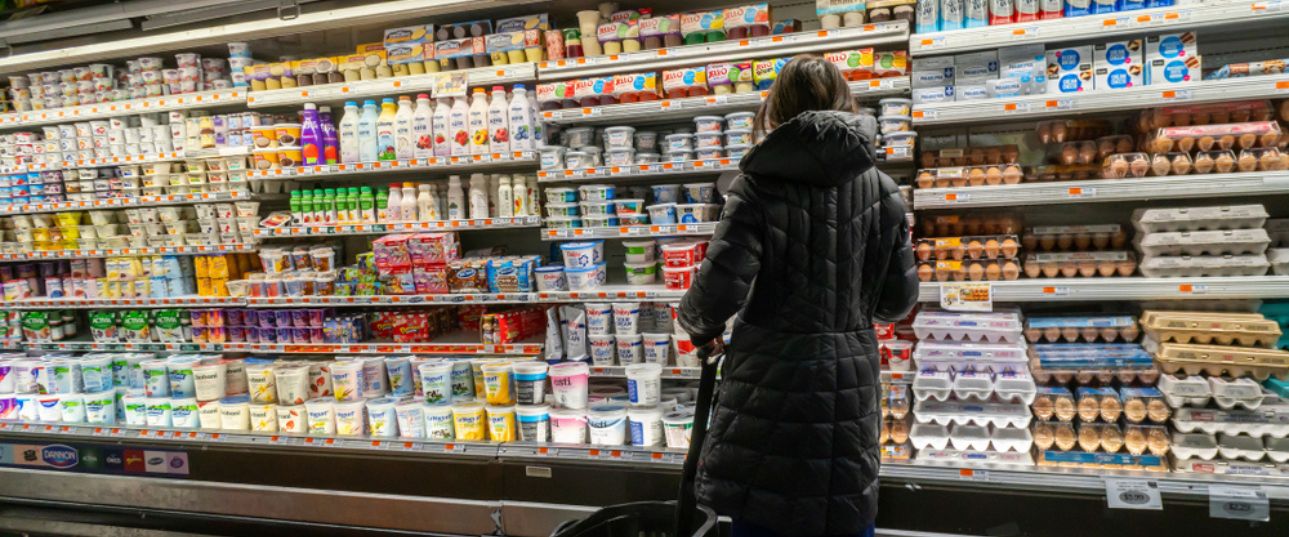
The food CPI went up 1.1% in July. It has increased by 0.9% for seven straight months, including July. The food at home CPI jumped 1.3% over the month, with all six major grocery store food CPIs soaring too. Over the past 12 months, the food at home index increased 13.1%, the largest year-over-year rise since the 12 months ending March 1979.
The non-alcoholic beverage CPI jumped at 2.3%, with coffee rising by 3.5%. The indexes of other food at home, such as cereals and bakeries, increased by 1.8% each.
In July, a 1.7% increase was registered for the dairy and related items index. That month, the CPI for poultry, eggs, fish, and meat increased by 0.5%, although it had dropped in June. The fruits and vegetables CPI also jumped 0.5% in July.
The July CPI for food away from home added 0.7% after increasing 0.9% the previous month. Year-over-year, this index rose 7.6%.
In the limited-service meals group, the CPI increased 0.8%, while full-service meals jumped 0.6% over that month.
Energy Index
The energy CPI declined 4.6% in July after adding 7.5% over the prior month. In contrast, the index increased 32.9% year over year.
Although the gasoline index soared 11.2% in June, it dropped 7.7% in July. Natural gas fell 3.6% despite its recent sharp increments. The equivalent price indicator for electricity rose 1.6% that month, following two successive monthly increases of 1.3% or more.
Year over year, the gasoline CPI jumped 44%, the fuel CPI 75.6%, and the natural gas CPI 30.5%. The electricity CPI had its highest 12-month increment at 15.2% since the year-over-year period ending February 2006.
CPI for All Items Less Food and Energy
The CPI for all items minus food and energy jumped 0.3% in July after a 0.7% increment the previous month. Year-over-year, the measure increased by 5.9%.
While shelter maintained its rising streak in July, the index increased by a smaller margin of 0.5%, unlike June when it rose 0.6%. The CPI for rent went up 0.7% that month.
Major Medicare component CPIs kept their upward trajectory, rising 0.4% in July after increasing 0.7% the previous month. In the auto insurance category, the CPI added 1.3% after rising 1.9% in June.
The household furnishings and operations CPI jumped 0.6% in July, following another upward change of 0.4% in June. Indexes for new vehicles and recreation also soared over the month, increasing by 0.6% and 0.3%, respectively.
A 7.8% decline in the airline fares index was reported in July. The second-hand cars and trucks index fell 0.4% after increasing consecutively over the two previous months.
Final Takeaway!
Are you looking forward to learning more about the BLS report containing July’s urban consumer price index? Contact us today by scheduling an appointment with the agents of Stan McKnight.